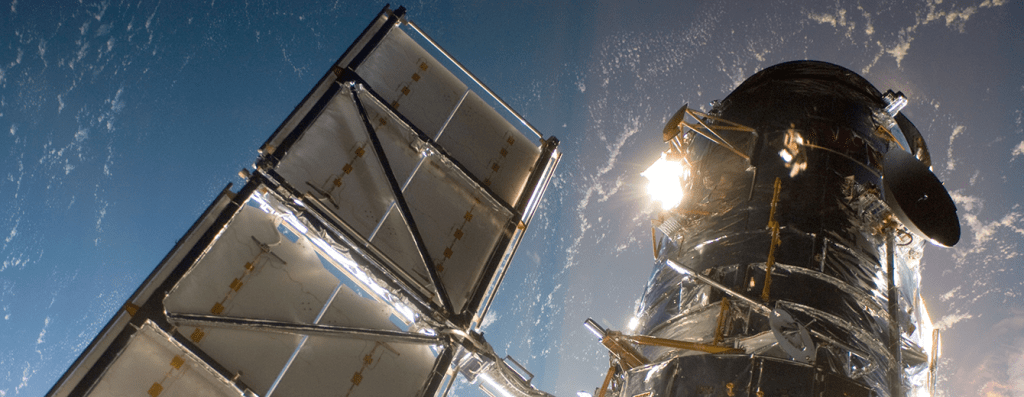
I enjoy my day job. I’m an astrophysicist and a professor. That comes with its fair share of mind-numbing meetings and stacks of papers to grade, but it also means I get to play with amazing toys, for example, Hubble Space Telescope (HST).
This article describes a small project HST project that I am working on. We’ll drill down into the guts of one of HST’s instruments (called STIS) and attempt to follow photons around down there. Spoiler: we will fail at the detailed level, but succeed at some less stringent level.
But let’s start at the beginning. Hubble Space Telescope is, as its name implies, a telescope in space. In low earth orbit, it circumnavigates the globe every 94 1/2 minutes. Solar panels catch sunlight during the 48-minute “days” to power the satellite. Gyroscopes point the telescope at a sky location. Generally, any given spot on the sky is also only available for 48 minutes. That’s often too short a time to get much science done, so when the earth gets out of the way again, the exact patch of sky needs to be re-acquired and exposures begin again.
Light from the target, be it clouds of gas, galaxies, stars, planets, or exotic objects streams into HST’s tube and bounces off a 2.4-meter-diameter mirror, and then bounces off a smaller secondary mirror to arrive at the focal plane. Five instruments sit there: two cameras, one spectrograph, one combined camera and spectrograph, and one interferometer. Each camera or spectrograph has various modes of operation and choices for filter or dispersing element. So, it gets a little complicated – but flush all that out of your brain.
HST has orbited since 1990, with ever-increasing science output due to increased efficiency. A crucial component could break any minute, but we don’t foresee any particular reason HST can’t keep working through roughly 2030, about 3x longer than anybody envisioned in the 1980s.
To become an HST “guest observer,” one must apply. And so, one must write a “telescope time proposal.” The initial proposal has a 4-page limit.
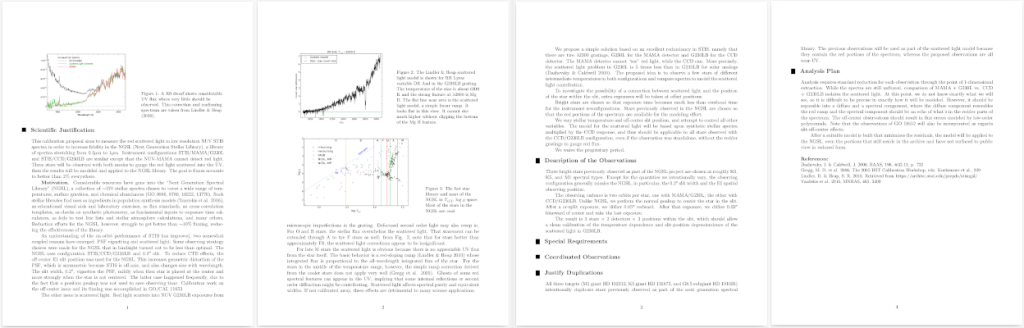
The image above is a shrunk version of a proposal I penned in 2020. I requested six orbits to address a particular instrumental issue that was bugging me. What issue? Time to drill into HST. The instrument in question is called STIS: Space Telescope Imaging Spectrograph. Stripped to nothing but light paths, here is a schematic.

I and several others had noticed that, when taking ultraviolet (UV) spectra of a red star, some stray light showed up. The cause is almost certainly microscopic imperfections in the grating – a piece of glass with a zillion parallel lines scratched into it. The job of the grating is to disperse the light. That is, make a rainbow.
Yes, HST is a rainbow machine.
The stray light should be subtracted, but we didn’t know how much stray light there was, or even if the stray light could be modeled. And hence my proposal. After a few months for committees to assemble and make judgements, I was awarded my six orbits. After a leap of joy, terror set in, for now I would have to specify exactly, and I mean exactly, what I wanted HST and all of its moving parts to do. This is called “phase 2” of the process.
I must’ve done that part correctly, because in the spring of 2021 the data came down. I observed three stars, and I observed each twice. Once through the grating that feeds the CCD light detector, and once through a different grating that feeds the MAMA detector. The distinction is crucial for my project because the MAMA only “sees” UV light, so it should be blind to redder light leaking through. [CCD = charge coupled device, and MAMA = multianode microchannel array detector. The job of both is to detect light (take a digital photo) and then save each image to a computer disk for later transfer to planet earth.]
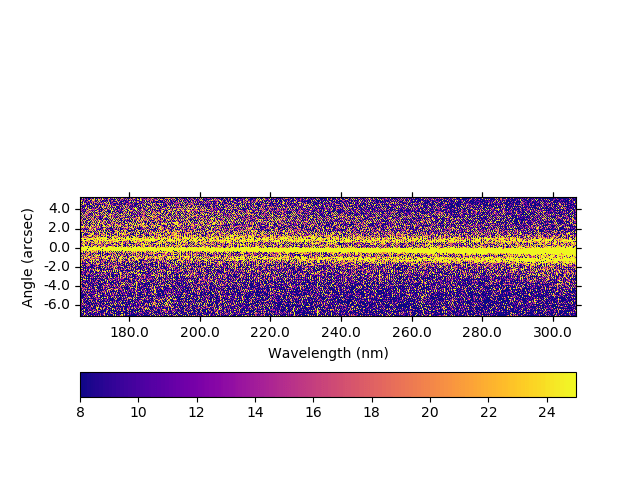
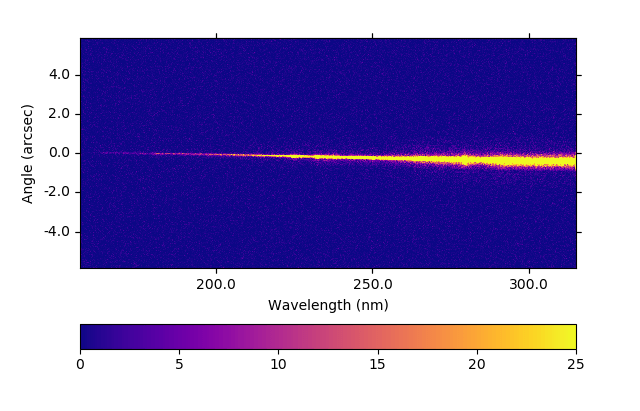
So I exploited a redundancy to gauge the amount of scattered light. When I compared the stray-light-affected images to the stray-light-blind images, I could subtract the two to discover how the amount of stray light varied with wavelength. That looks like this.
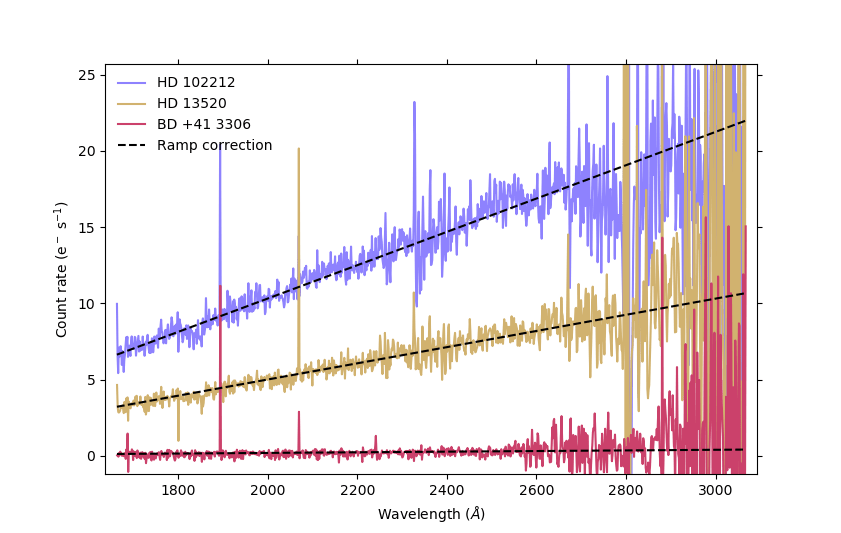
The overall shapes look like wedges, and that simple shape was a lucky break: it could have been much stranger. But due to the simplicity of the shape, I could cook up a linear formula to account for it. I found that the amount (say, at 2000 Angstroms) of correction scaled with the brightness of the star in the green (V band), but the ramp slope stayed the same for all stars.
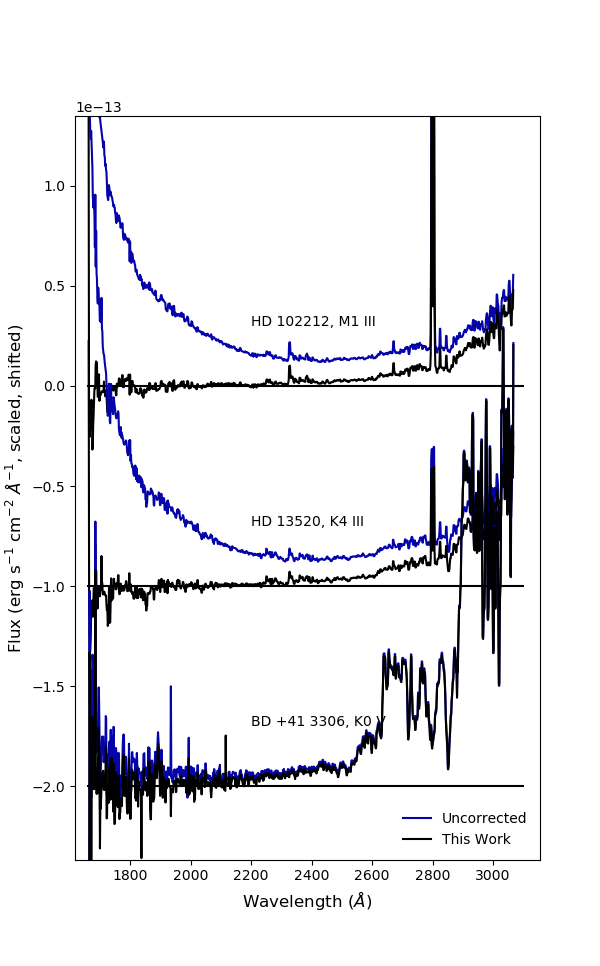
Once the scattered light is modeled, all one needs is the brightness of the star at visual wavelengths to estimate the amount. With a quick subtraction, voila, the spurious UV flux goes away.
This observing mode is not the most common on HST, but there are over 3000 observations that can benefit from this correction, and more on the way. I am happy to have made my small contribution to the fidelity of the instrument, and of course the accurate science that may flow from it.
What did I leave out? Feel free to pepper me with questions.

Nice
LikeLiked by 1 person
It sounds like your work could really be useful for future observations.
LikeLiked by 1 person